
Although this might sound alarming, there really is nothing to worry about!
It’s a normal part of the solar cycle – it heralds the second half of the solar cycle. Learn about why this happens.
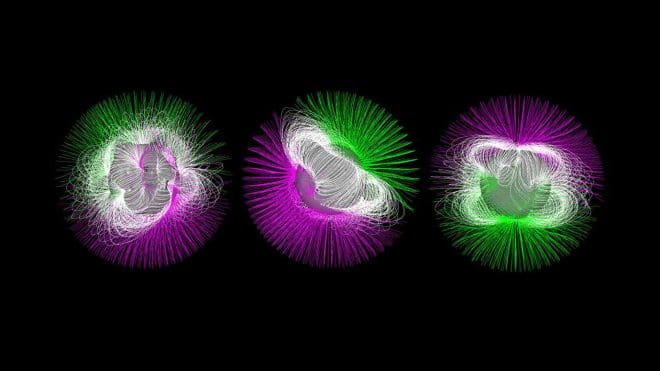
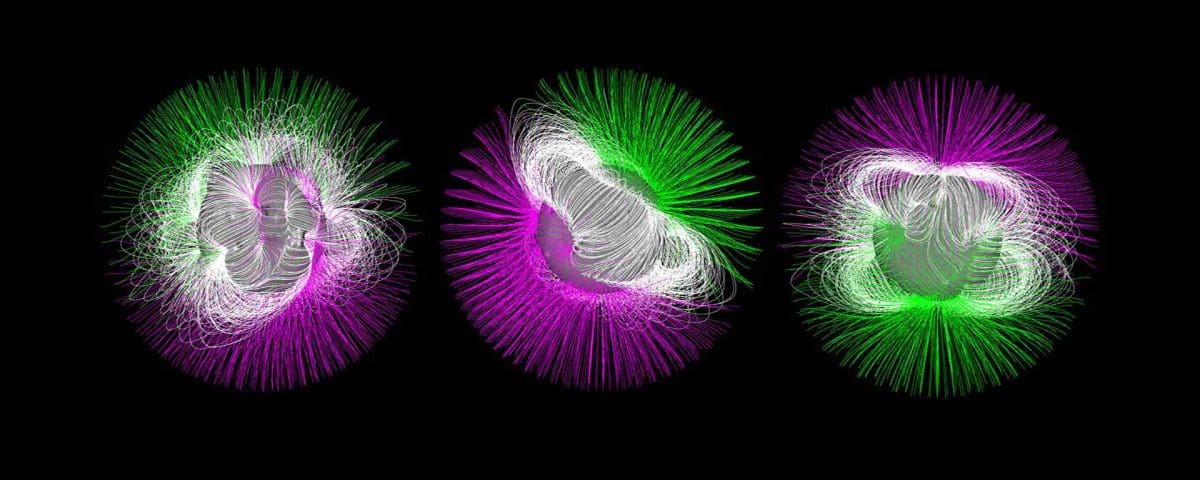
Image showing the sun’s magnetic fields on Jan. 1, 1997, June 1, 2003, and Dec. 1, 2013. Green indicates positive polarity. Purple is negative.
At a Glance
- The sun’s magnetic fields flip approximately every 11 years, defining the solar cycle
- The switch happens around the peak of solar activity or the time we call solar maximum.
- This reversal tells scientists that the second half of the solar cycle has begun.
- The flip will likely cause more space weather, including aurora
When did the magnetic poles flip in Solar Cycle 24?
Both poles have now flipped. The north pole changed its polarity from positive to negative and the south pole changed from negative to positive. Scientists believe the north pole finished the change in June 2012 and the south pole change happened in July 2013.
What causes the flip?
The sun’s magnetic field is generated by a complex process inside the sun called the solar dynamo. The magnetic field starts off as basically up and down, i.e. roughly straight lines between the north and south poles.
The sun is not solid so the equator rotates the fastest and as you move away from the equator, the sun rotates at slower and slower speeds. The sun takes about 25 days to make a complete rotation at the equator and about 35 days at the north or south pole.
The sun is made up of a type of material called plasma and plasmas are magnetic. This means the plasma drags the magnetic field with it over time as it is rotating. The field gets all twisted (like a twisted rubber band) and eventually floats to the visible surface of the sun (photosphere). The magnetic field comes through the photosphere in concentrated regions called sunspots.
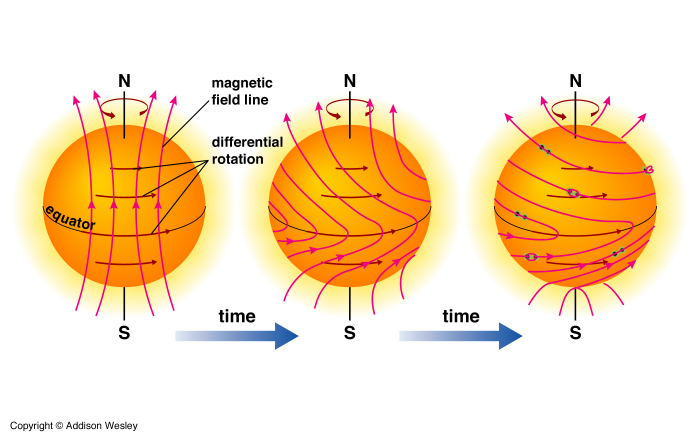
At the same time these concentrations of magnetic field slowly creep towards the north or south pole. The magnetic fields are primarily one polarity in the north and the opposite in the south. The fields that creep towards the poles are opposite polarity to the fields at the poles. The strength of the magnetic field at each pole slowly reduces to zero until it switches polarity. The switch happens around the peak of solar activity or the time we call solar maximum.
(credit: NASA GSFC Scientific Visualization Studio)
This visualization shows the position of the sun’s magnetic fields from January 1997 to December 2013. The field lines swarm with activity: The magenta lines show where the sun’s overall field is negative and the green lines show where it is positive. Additional gray lines represent areas of local magnetic variation.
The entire sun’s magnetic polarity flips approximately every 11 years – though sometimes it takes quite a bit longer – and defines what’s known as the solar cycle. The visualization shows how in 1997, the sun shows the positive polarity on the top and the negative polarity on the bottom. Over the next 16 years, each set of lines is seen to creep toward the opposite pole.
By the end of the movie, the flip is almost complete.
What does this mean for us?
“While this is not a catastrophic event, the reversal will have effects, said solar physicist Todd Hoeksema, the director of Stanford University’s Wilcox Solar Observatory, who monitors the Sun’s polar magnetic fields. “This change will have ripple effects throughout the Solar System,” he said.
One of the ripples that Dr. Hoeksema is referring to is the heliospheric current sheet. This is a giant surface of electrical current coming out from the solar equator. It is created by the moving solar magnetic fields, moving because the sun is rotating. This huge sheet of current spirals out from the sun as a wavy structure kind of like a giant ballerina skirt. It is about 10,000 km thick and stretches out for billions of kilometers in all directions.
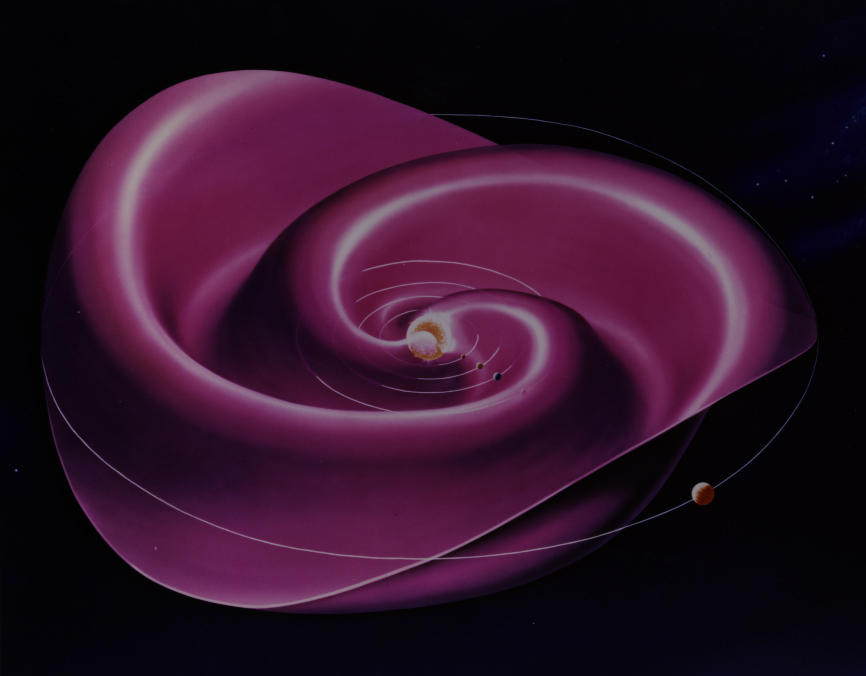
An illustration of the heliospheric current sheet. Credit: NASA
As the sun’s magnetic fields are reversing, the current sheet becomes even wavier. As the planets orbit the sun they move in and out of the current sheet like going over and under waves of water in the ocean.
Traveling in and out of this current sheet can create upticks in the impact of solar storms here on Earth. So that means more space weather is likely, including more aurora.
The current sheet also affects cosmic rays. These are super high-energy particles created by supernova explosions far outside of our solar system. They pose a threat to astronauts in space as well as spacecraft exploring our solar system. The wavy current sheet helps to deflect cosmic rays keeping them out of the inner solar system.
Why are scientists only now certain the flip happened?
We have been certain about the north for about a year but we have been waiting to confirm the switch at the south, we are certain that it has changed only now. The process is gradual and not sudden. We are only now certain about the south because the data is so difficult to interpret. The data is messy and fluctuates (wiggles) a lot.
Looking at plots of the northern and solar polar magnetic fields we can see that there are big up and down motions of the magnetic field around zero. This is happening on timescales of a solar cycle (~11 years) but there are also smaller wiggles up and down happening on smaller timescales (~1 year). So the large-scale ups and downs are due to the sun but as we discuss below the small wiggles are because the apparent position of the observed sun changes with the time of year.
So we can see that when the magnetic fields are getting close to zero the value of the magnetic fields moves back and forth around the zero line. This makes it difficult to say that the fields are one sign or the other until well after they have actually crossed the zero line. It takes at least six months to know for sure. This is why, even though the south polarity changed around July 2013, we were not really certain until Dec. 2013/Jan. 2014. Science can be messy.
40 years of the solar northern polar magnetic field measured by the Stanford Wilcox Solar Observatory.
Where does the solar polar field data come from?

The Wilcox Solar Observatory, at Stanford University.
The measurements of the polar magnetic field comes primarily from one place, The Wilcox Solar Observatory, at Stanford University. The observatory is directed by Dr. Phil Scherrer and run by Dr. Todd Hoeksema. The Wilcox Observatory or WSO has been measuring the solar polar fields continuously for over 40 years.
No other dataset of its kind exists in the world. The observatory measures the line-of-sight solar magnetic field between about 55 degrees latitude and the solar poles. As Earth moves above and below the solar equator each year the telescopes measure the location of the sun shift. So depending on the observatory instruments and the date, the orientation of the measurements change.
The primary data of the polar fields from WSO has as little computer processing as is possible. Measurements are taken each day and every 10 days the usable data is averaged over 30 days. Additional processing is done to account for the yearly change in the apparent position of the sun which is causing the 1 year ups and downs in the data shown above. The animated gif below shows how the position of the sun as viewed from Earth changes over the year. This means that we are not observing the sun and its magnetic poles uniformly over time.
Sun as it appears from the Earth during the period of a year (at 7 day intervals).
This is why the world experts made statements like this towards the end of 2013 even though now we know the south had already changed:
“The sun’s north pole has already changed sign, while the south pole is racing to catch up,” said Dr. Phil Scherrer. “Soon, however, both poles will be reversed, and the second half of solar max will be underway.”
credit: NASA/GSFC SVS/Stanford University Solar Center/Stanford’s Wilcox Solar Observatory
