
July is summer in the northern hemisphere and you might think this means we are closer to the Sun.
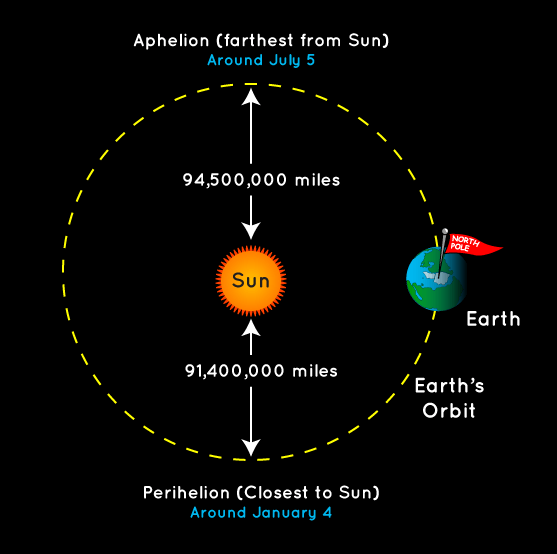
This is a common misconception. Earth is actually farther from the Sun in July and on July 3rd it is at its farther distance in orbit around the Sun. Earth’s orbit around the Sun is an ellipse. Its closest approach to the Sun in this orbit is called perihelion and its farthest is called aphelion.
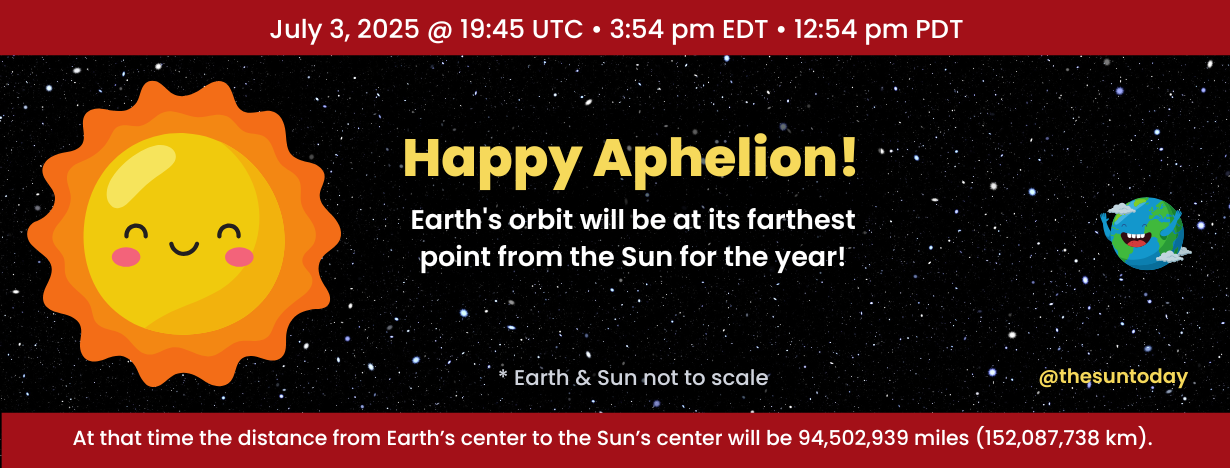
This farthest point occurs on July 3, 2024 @ 19:54 UTC, 3:54 pm EST • 12:54 pm PST. At that time the distance from Earth’s center to the Sun’s center will be 94,502,939 miles (152,088,848 km).

The table below shows the date/time and distances for perihelion and aphelion from 2024 to 2028.
| Year | Perihelion | Distance | Aphelion | Distance |
|---|---|---|---|---|
| 2025 | January 4, 2025 8:28 am | 91,405,993 mi | July 3, 2025 3:54 pm | 94,502,939 mi |
| 2026 | January 3, 2026 12:15 pm | 91,403,637 mi | July 6, 2026 1:30 pm | 94,502,962 mi |
| 2027 | January 2, 2027 9:32 pm | 91,406,556 mi | July 5, 2027 1:05 am | 94,510,857 mi |
| 2028 | January 5, 2028 7:28 am | 91,404,129 mi | July 3, 2028 6:18 pm | 94,506,289 mi |
| 2029 | January 2, 2029 6:13 pm | 91,402,677 mi | July 6, 2029 5:11 am | 94,509,351 mi |
| * All aphelion/perihelion times are in local Eastern time (ET). | ||||
You may ask yourself: Is there any relationship between perihelion/aphelion with the solstices since they are kind of close to one another?
Well yes, they always happen close to one another. Aphelion happens about 2 weeks after the July solstice and perihelion happens about 2 weeks after the December solstice.
One of the crazy things about the extremes in Earth’s orbit around the Sun is the Sun’s apparent size in the sky. During perihelion the Sun is a little closer to us and aphelion it is a little farther from us. So this means that the Sun’s apparent size in the sky changes very slightly, i.e. when it is closer (perihelion) it appears slightly larger and when it is farther (aphelion) it appears slightly smaller.
This is just perspective. These size differences are almost unnoticeable. In fact, you really need a telescope to see this difference.
(NOTE: Do not forget – never look at the Sun with the unaided eye and especially never look at the magnified Sun with binoculars or telescopes unless you have the correct special filters!!)
The composite image below, taken with a special telescope, allows us to see this subtle size difference of the Sun between perihelion and aphelion.
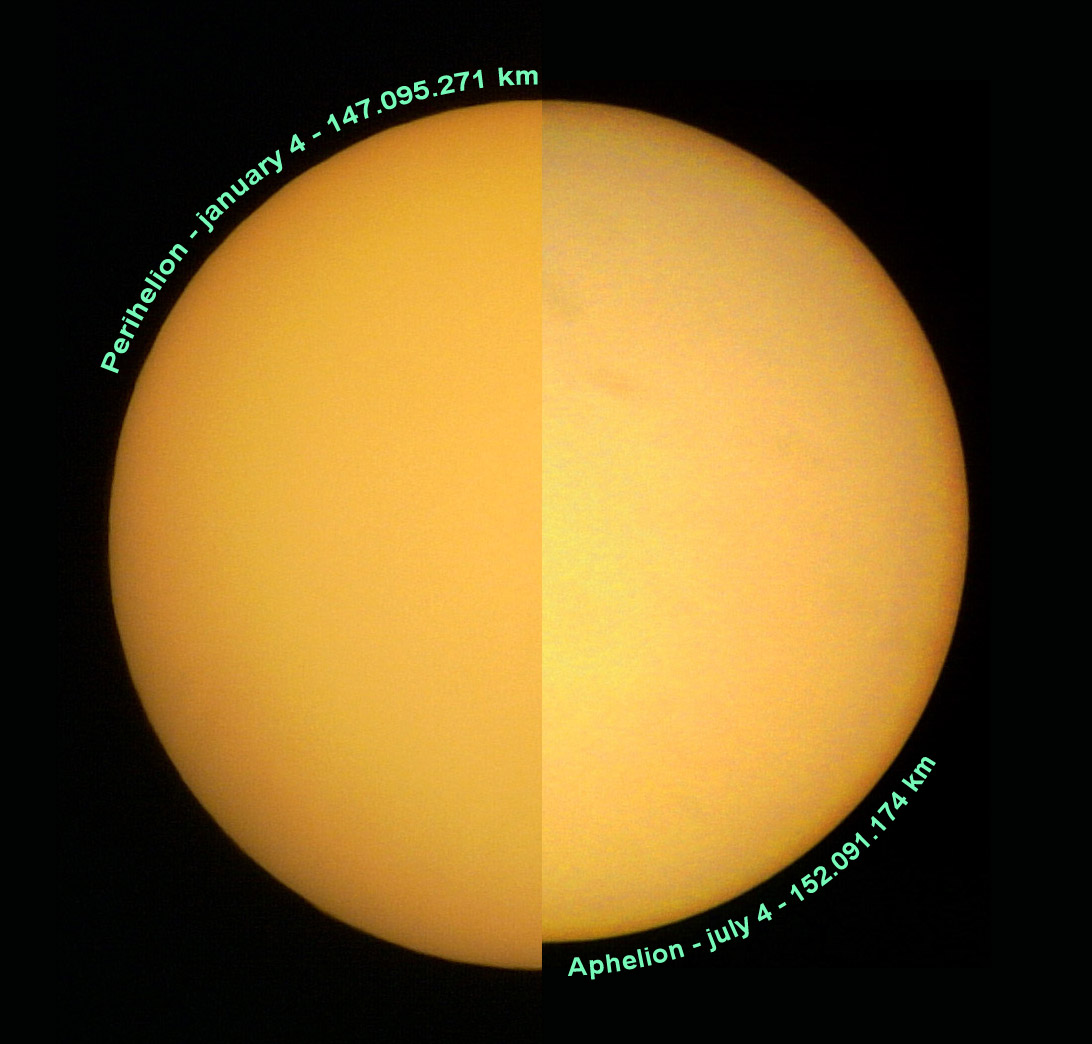
This composite neatly compares two pictures of the Sun taken with the same telescope and camera on the dates of Perihelion (closest approach) and Aphelion in 2008. The image labels include Earth’s distance in kilometers from the Sun on the two dates. (credit: NASA APOD/Enrique Luque Cervigón)
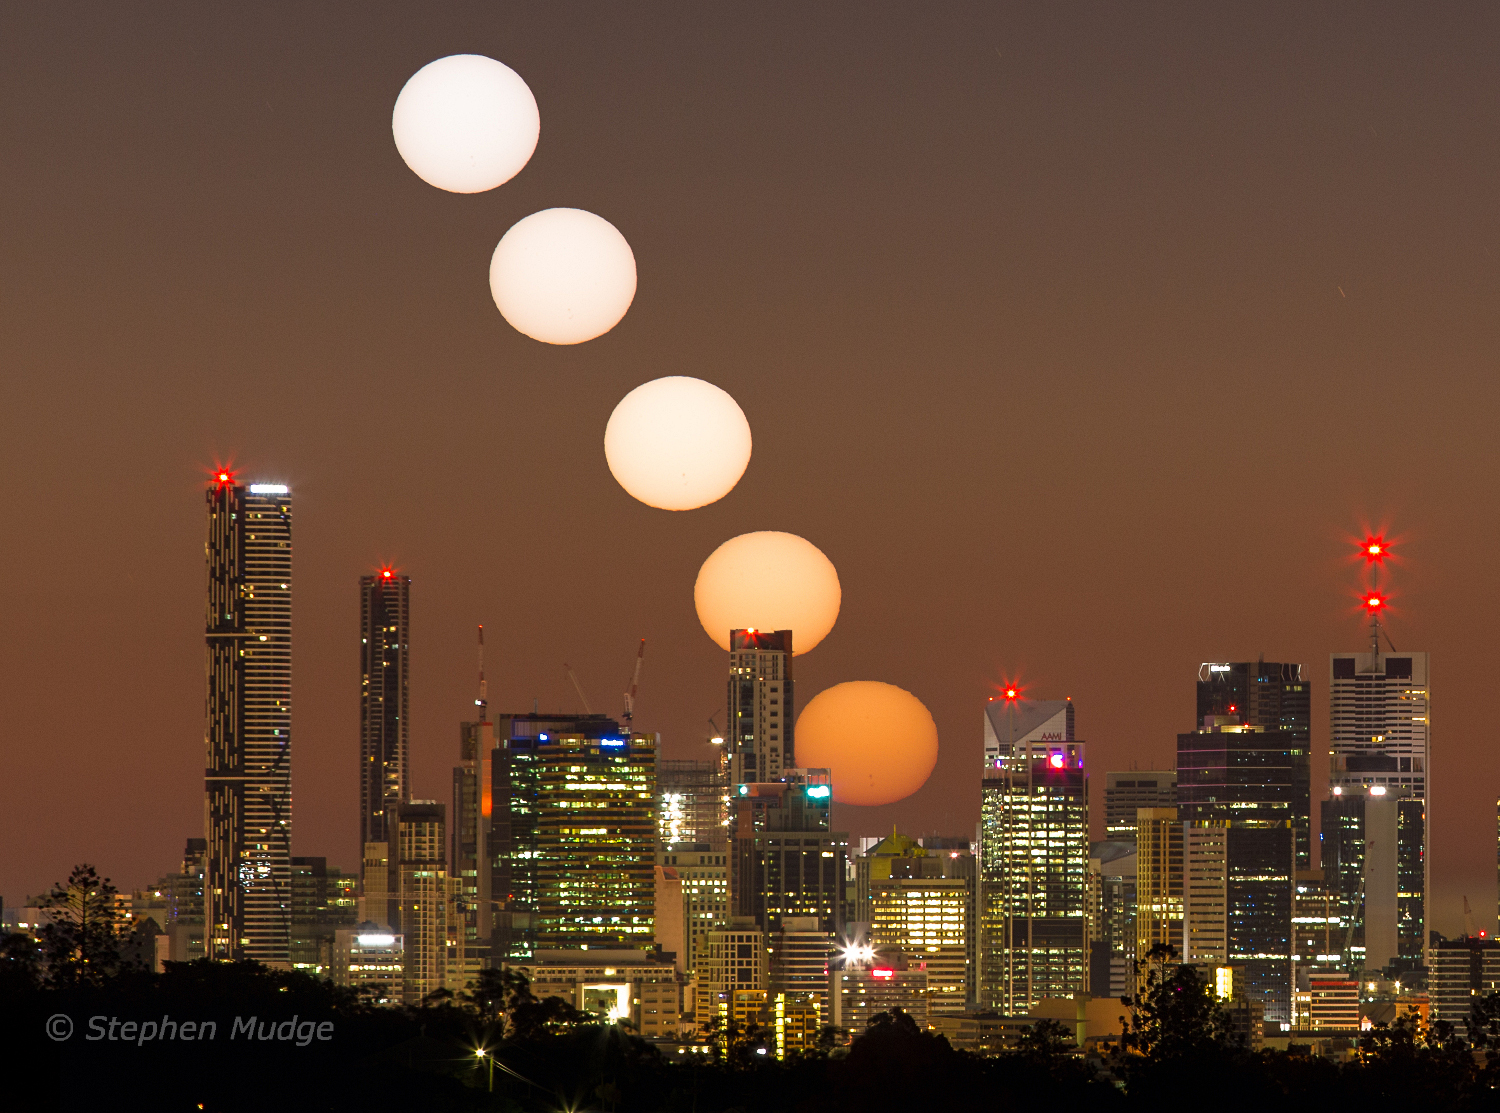
Aphelion Sunrise shared on Astronomy Picture of the Day, https://apod.nasa.gov/apod/ap170705.html
Image Credit & Copyright: Stephen Mudge
🌍 Why Aphelion Distances Don’t Always Match
If you’ve ever gone looking for the “exact” time or distance of Earth’s aphelion and found multiple answers, you’re not imagining things. Aphelion isn’t a solid wall in space that Earth slams into — it’s a calculated moment when Earth is farthest from the Sun in its elliptical orbit. That moment can differ slightly depending on how and when it’s measured.
Even the most trusted astronomy sources sometimes report slightly different values. You’ll find variations of 1–2 seconds in timing and up to 800 meters (about half a mile) in distance. Here’s why:
🔍 What’s Behind the Differences?
-
Different ephemeris datasets: NASA’s JPL Horizons system uses high-precision models (like DE441), while some astronomy calendars use simplified methods like Meeus’ algorithms. Both are valid — but they won’t give exactly the same results.
-
Center-of-mass vs. surface measurements: Are we measuring from Earth’s center to the Sun’s center? Or from surface to surface? These tiny changes can add or subtract kilometers.
-
Rounding and formatting: Some sources round off the distance to the nearest mile or kilometer. Others format the time in local time zones, which adds another layer of apparent inconsistency.
-
Media simplification: Outlets like EarthSky or Almanac often publish estimates that are friendly for general readers, while tools like JPL Horizons allow for millisecond precision.
🧭 Compare for Yourself
Here’s a chart of reported aphelion values for July 3, 2025, showing how these tiny differences show up depending on the source:
| Source | Date (UTC) | Time (UTC) | Time (ET) | Distance (mi) | Distance (km) |
|---|---|---|---|---|---|
| NASA JPL Horizons | July 3, 2025 | 19:54 | 3:54 PM | 94,502,941 | 152,087,740 |
| US Naval Observatory | July 3, 2025 | 19:55 | 3:55 PM | 94,502,939 | 152,087,738 |
| Timeanddate.com | July 3, 2025 | 19:54 | 3:54 PM | 94,502,939 | 152,087,738 |
| EarthSky | July 3, 2025 | 20:00 | 4:00 PM | 94,502,714 | 152,087,376 |
| In-The-Sky.org | July 3, 2025 | 19:54 | 3:54 PM | ~94,502,939 | ~152,087,738 |
| Old Farmer’s Almanac | July 3, 2025 | 19:54 | 3:54 PM | 94,502,939 | 152,088,132 |
| TheWeather.com | July 3, 2025 | 20:11:47 | 4:11 PM | ~94,502,939 | 152,088,132 |
🧠 Want to Go Deeper?
If you’re a space-data nerd (welcome to the club 🛰️), check out NASA’s JPL Horizons System. It lets you generate custom orbital data for Earth and other planets — down to the second and meter. Just be prepared to go down a fun and nerdy rabbit hole.
🌍 How Fast Is Earth Moving at Aphelion?
-
29,320 meters per second
-
≈ 65,560 mph
-
≈ 105,560 km/h
That’s ~18.6 miles per second — even at its slowest, Earth is really moving.
💡 Bonus Fun Fact:
At perihelion, Earth speeds up to around 30,290 m/s — nearly 970 m/s faster than at aphelion!
This variation is a direct result of Kepler’s 2nd Law: planets sweep out equal areas in equal times, so they must go faster when closer to the Sun, and slower when farther away. So while it might be “slowing down” at aphelion, Earth is still moving nearly 19 miles per second. 🚀
So happy aphelion and your farthest distance from the Sun!


