
Wavelengths of Light
The Solar Dynamics Observatory (SDO) images 10 different wavelengths. The “false colors” are chosen to best highlight features in each wavelength.
The Sun emits light in all colors, but since yellow is the brightest wavelength from the sun, that is the color we see with our naked eye. Specialized instruments can observe light far beyond the ranges visible to the naked eye.
Different wavelengths convey information about different components of the sun’s surface and atmosphere.
The Solar Dynamics Observatory, or SDO, images 10 different wavelengths, measured in angstroms (Å), with its Atmospheric Imaging Assembly (AIA) instrument. SDO’s Helioseismic and Magnetic Imager (HMI) instrument focuses on the movement and magnetic properties of the sun’s surface and provides 3 additional images.

The different images below are the latest data from the Sun, as seen by the Solar Dynamics Observatory (SDO).
Updated multiple times daily. To view a larger image, click the image or use the links for 4096 • 2048 • 1024 • 48hr mp4.
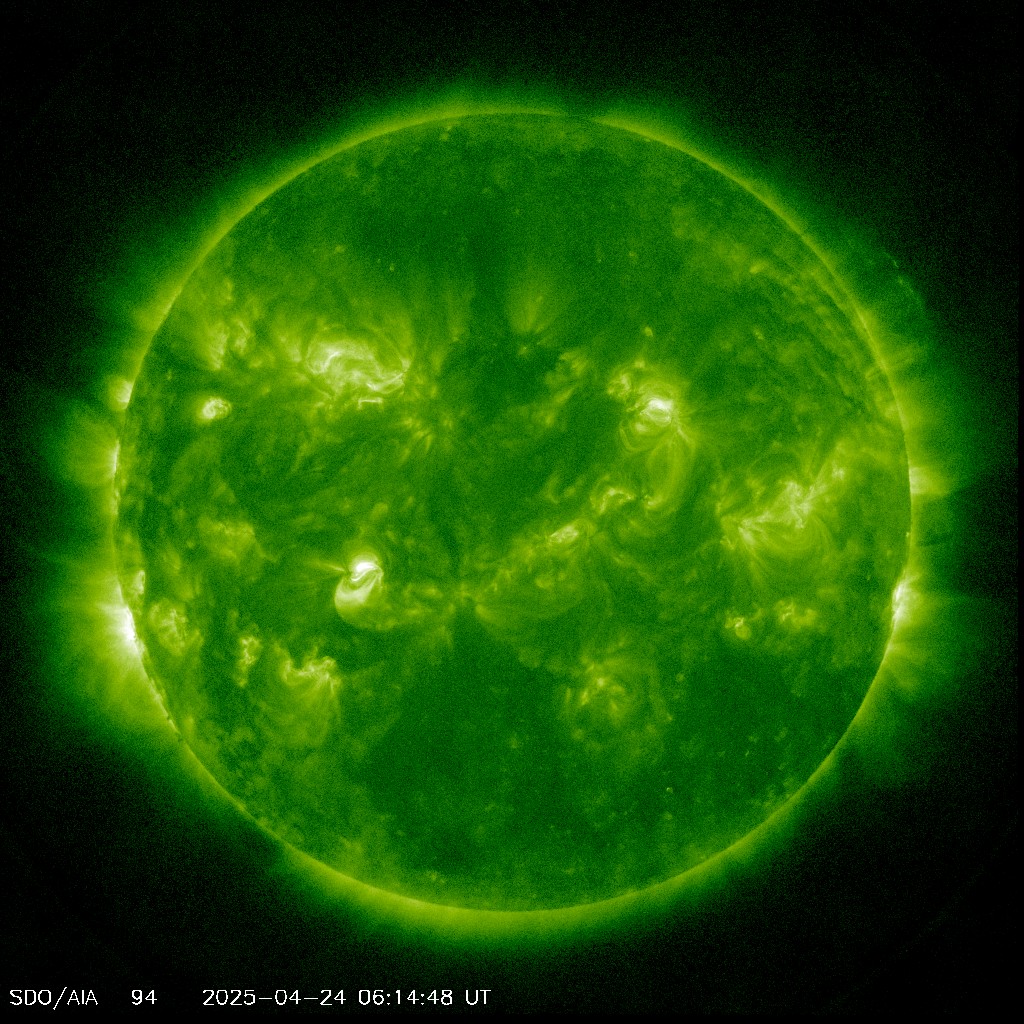
SDO AIA 094 Angstrom – AIA 094 Å
This highlights regions of the corona during a solar flare.
This channel (as well as AIA 131) is designed to study solar flares. It measures extremely hot temperatures around 6 million Kelvin (10.8 million F). It can take images every 2 seconds (instead of 10) in a reduced field of view in order to look at flares in more detail.
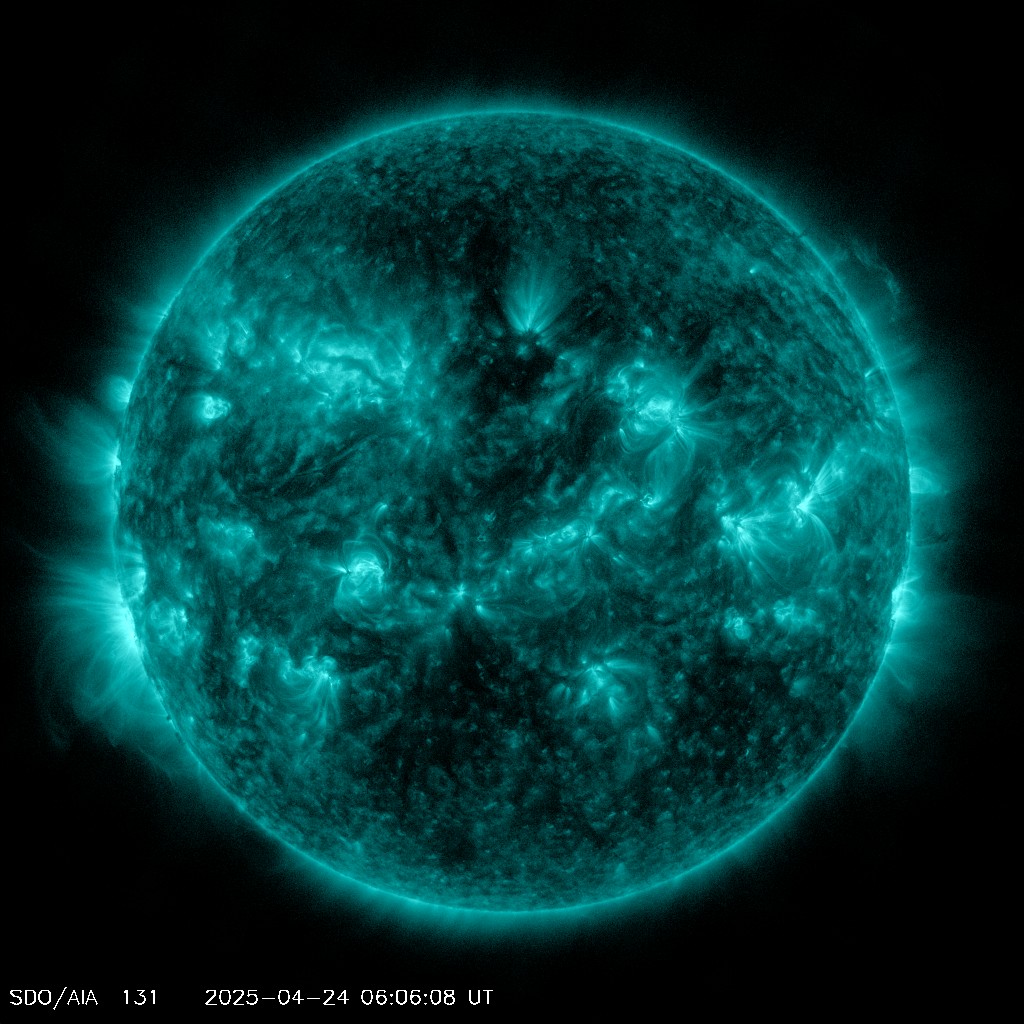
SDO AIA 131 Angstrom – AIA 131 Å
The hottest material in a flare.
This channel (as well as AIA 094) is designed to study solar flares. It measures extremely hot temperatures around 10 million K (18 million F), as well as cool plasmas around 400,000 K (720,000 F). It can take images every 2 seconds (instead of 10) in a reduced field of view in order to look at flares in more detail.

SDO AIA 171 Angstrom – AIA 171 Å
This wavelength shows the sun’s atmosphere, or corona, when it’s quiet. It also shows giant magnetic arcs known as coronal loops.
This channel is especially good at showing coronal loops – the arcs extending off of the Sun where plasma moves along magnetic field lines. The brightest spots seen here are locations where the magnetic field near the surface is exceptionally strong.
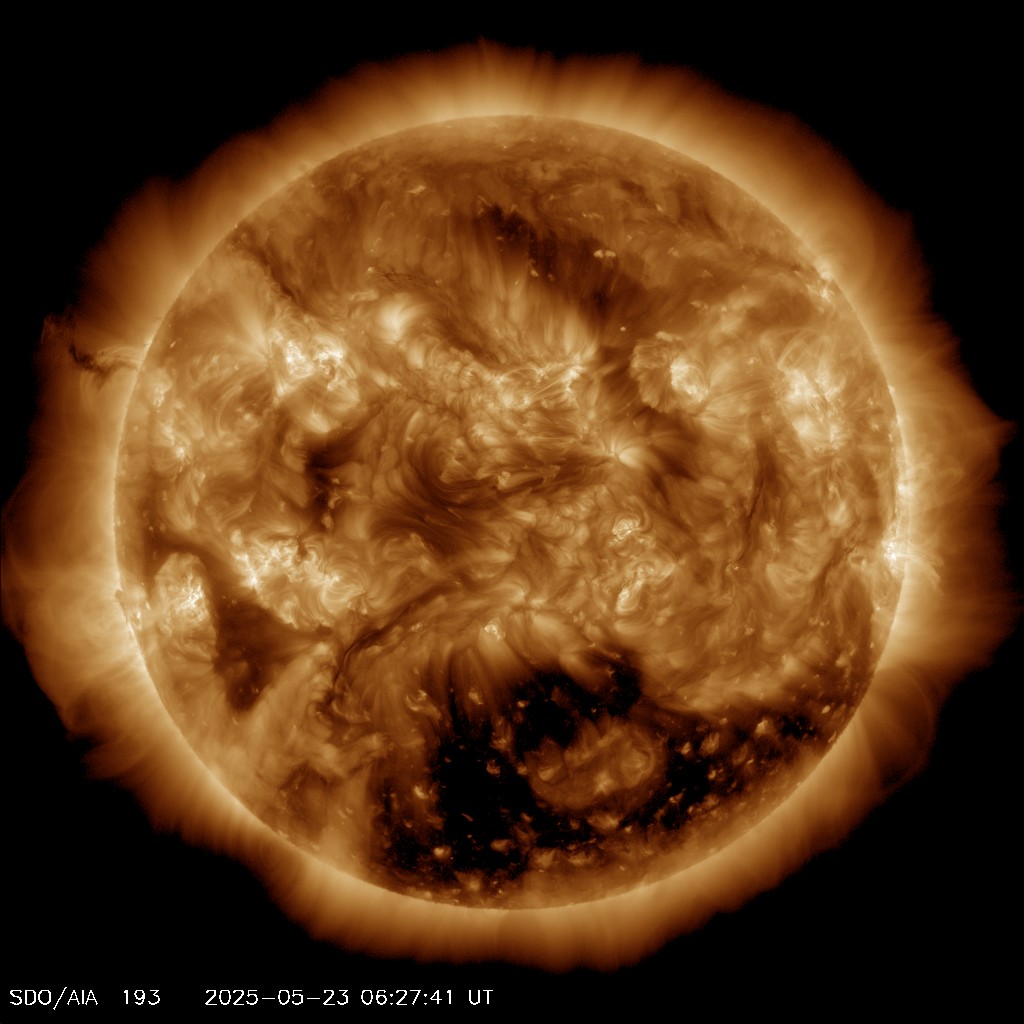
SDO AIA 193 Angstrom – AIA 193 Å
Shows a slightly hotter region of the corona, and also the much hotter material of a solar flare.
This channel highlights the outer atmosphere of the Sun – called the corona – as well as hot flare plasma. Hot active regions, solar flares, and coronal mass ejections will appear bright here. The dark areas – called coronal holes – are places where very little radiation is emitted, yet are the main source of solar wind particles.

SDO AIA 211 Angstrom – AIA 211 Å
This wavelength shows hotter, magnetically active regions in the sun’s corona.
This channel (as well as AIA 335) highlights the active region of the outer atmosphere of the Sun – the corona. Active regions, solar flares, and coronal mass ejections will appear bright here. The dark areas – called coronal holes – are places where very little radiation is emitted, yet are the main source of solar wind particles.
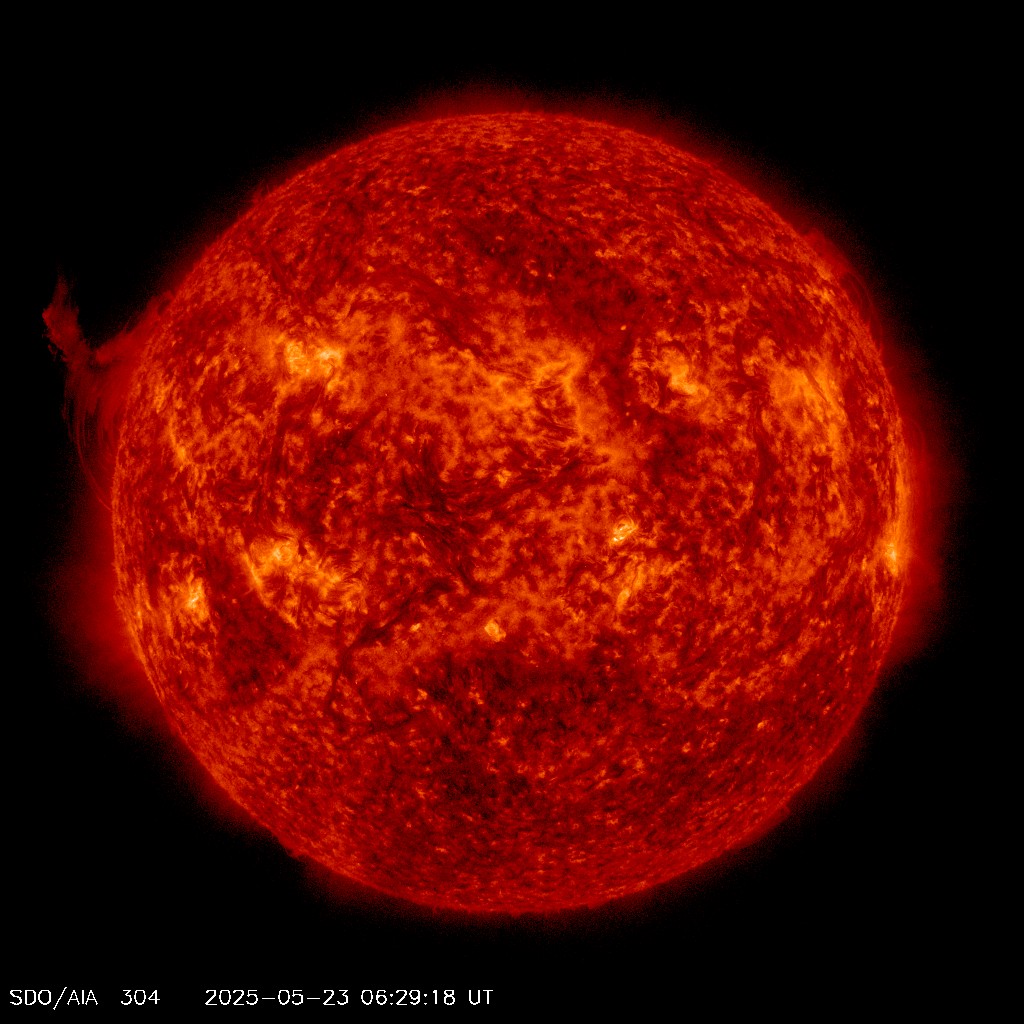
SDO AIA 304 Angstrom – AIA 304 Å
This light is emitted from the chromosphere and transition region.
This channel is especially good at showing areas where cooler dense plumes of plasma (filaments and prominences) are located above the visible surface of the Sun. Many of these features either can’t be seen or appear as dark lines in the other channels. The bright areas show places where the plasma has a high density.
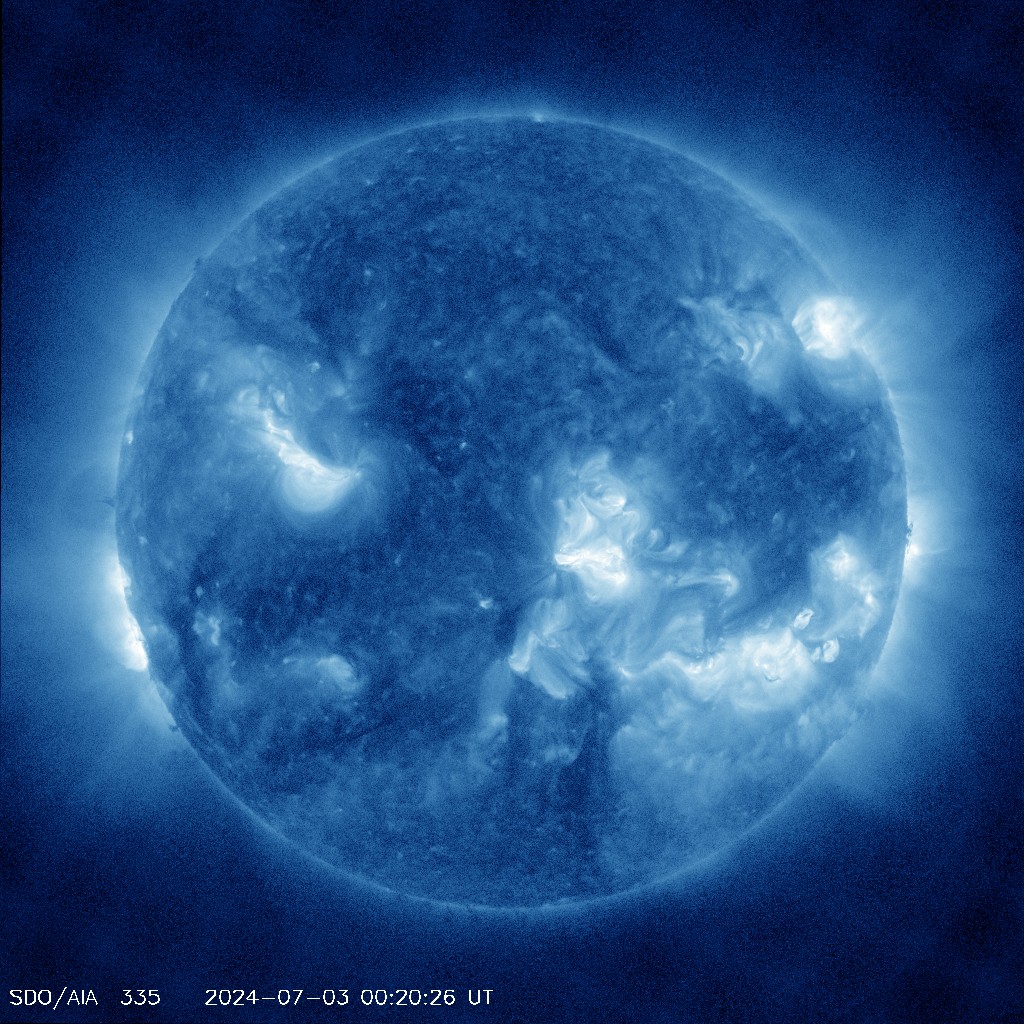
SDO AIA 335 Angstrom – AIA 335 Å
This wavelength also shows hotter, magnetically active regions in the corona.
This channel (as well as AIA 211) highlights the active region of the outer atmosphere of the Sun – the corona. Active regions, solar flares, and coronal mass ejections will appear bright here. The dark areas – or coronal holes – are places where very little radiation is emitted, yet are the main source of solar wind particles.
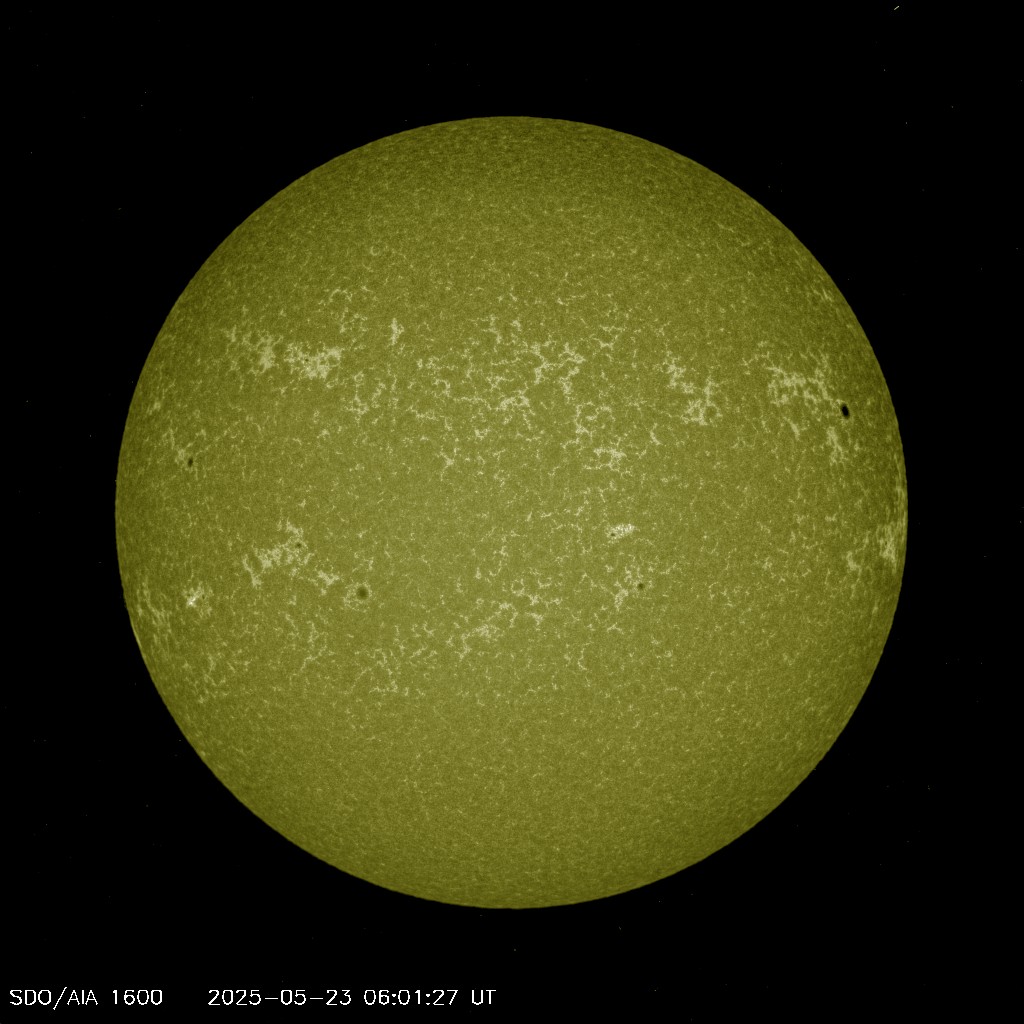
SDO AIA 1600 Angstrom – AIA 1600 Å
Shows a mixture between the upper photosphere and what’s called the transition region, a region between the chromosphere and the upper most layer of the sun’s atmosphere called the corona. The transition region is where the temperature rapidly rises.
Emitted by carbon-4 (C IV) between 5,000 – 10,000 Kelvin. C IV at these temperatures is present in the upper photosphere and what’s called the transition region, a region between the chromosphere and the upper most layer of the sun’s atmosphere called the corona. The transition region is where the temperature rapidly rises. SDO images of this wavelength are typically colorized in dark, grainy yellow.
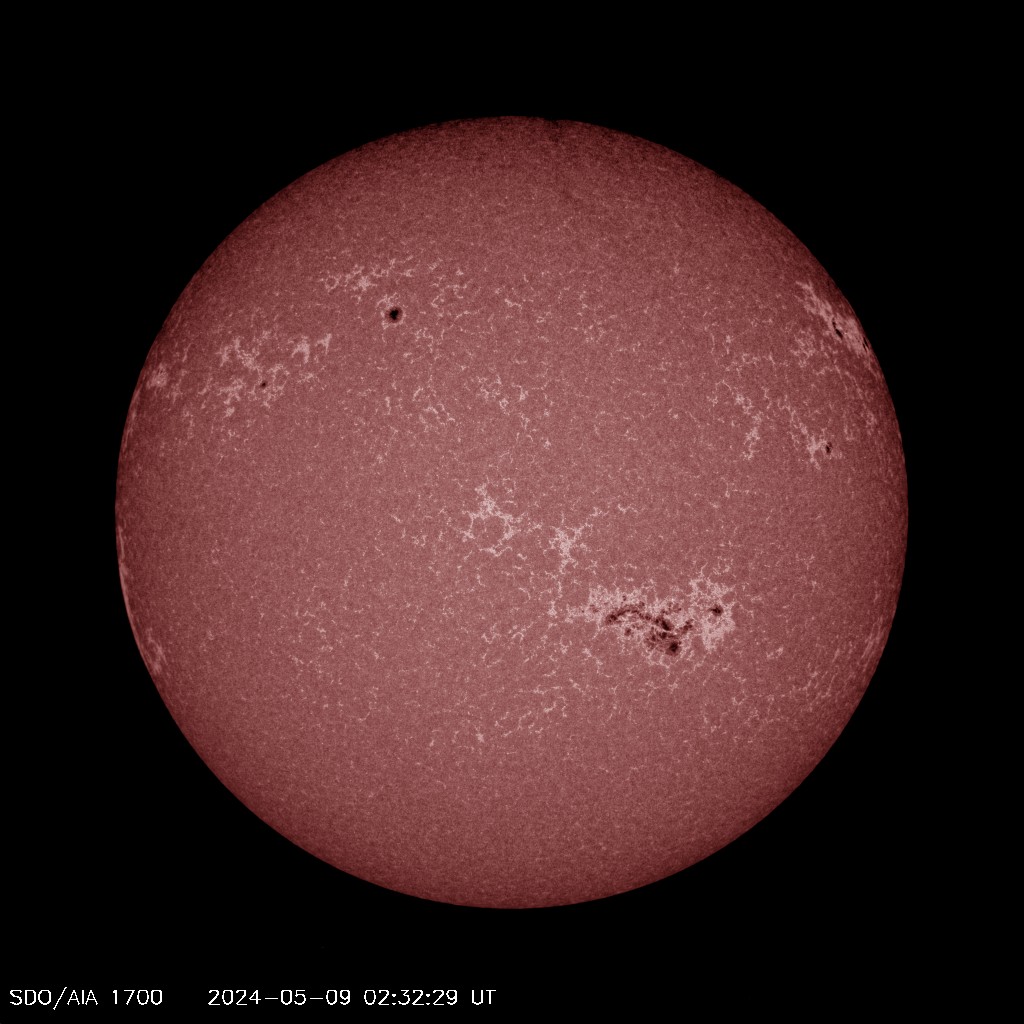
SDO AIA 1700 Angstrom – AIA 1700 Å
Shows surface of the sun, as well as a layer of the sun’s atmosphere called the chromosphere, which lies just above the photosphere and is where the temperature begins rising.
Ultraviolet light continuum, shows the surface of the sun. As well as a layer of the sun’s atmosphere called the chromosphere, which lies just above the photosphere and is where the temperature begins rising and is typically colorized in a grainy pink.
- Solar Region: Photosphere/Chromosphere
- Temperatures: 4,500-5,000 Kelvin
- View larger: 4096 • 2048 • 1024 • 48hr mp4

SDO AIA 4500 Angstrom – AIA 4500 Å
Showing the sun’s surface or photosphere.
White light continuum, shows the sun’s surface or photosphere in visible light; Continuums provide photographs of the solar surface, incorporating a broad range of visible light in the temperature of 5,000-6,000 Kelvin and appears in bright yellow.
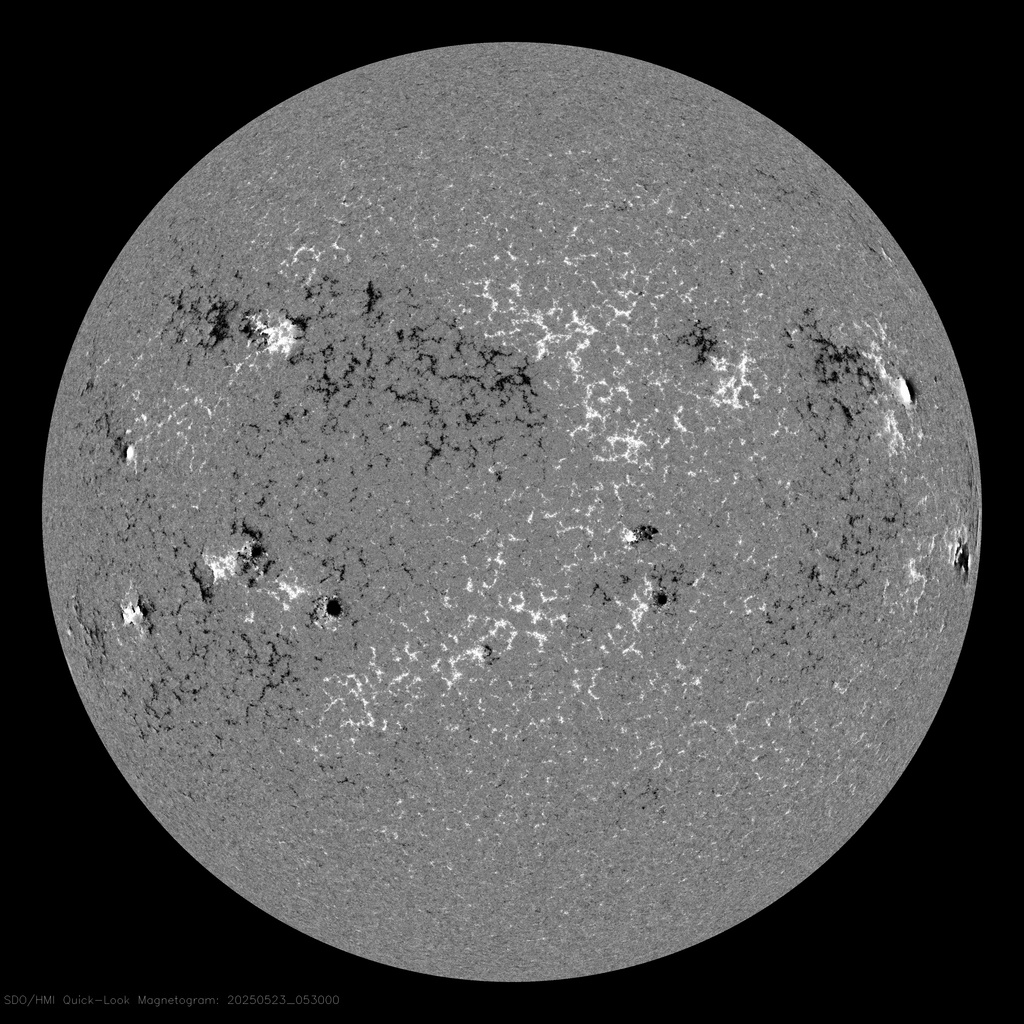
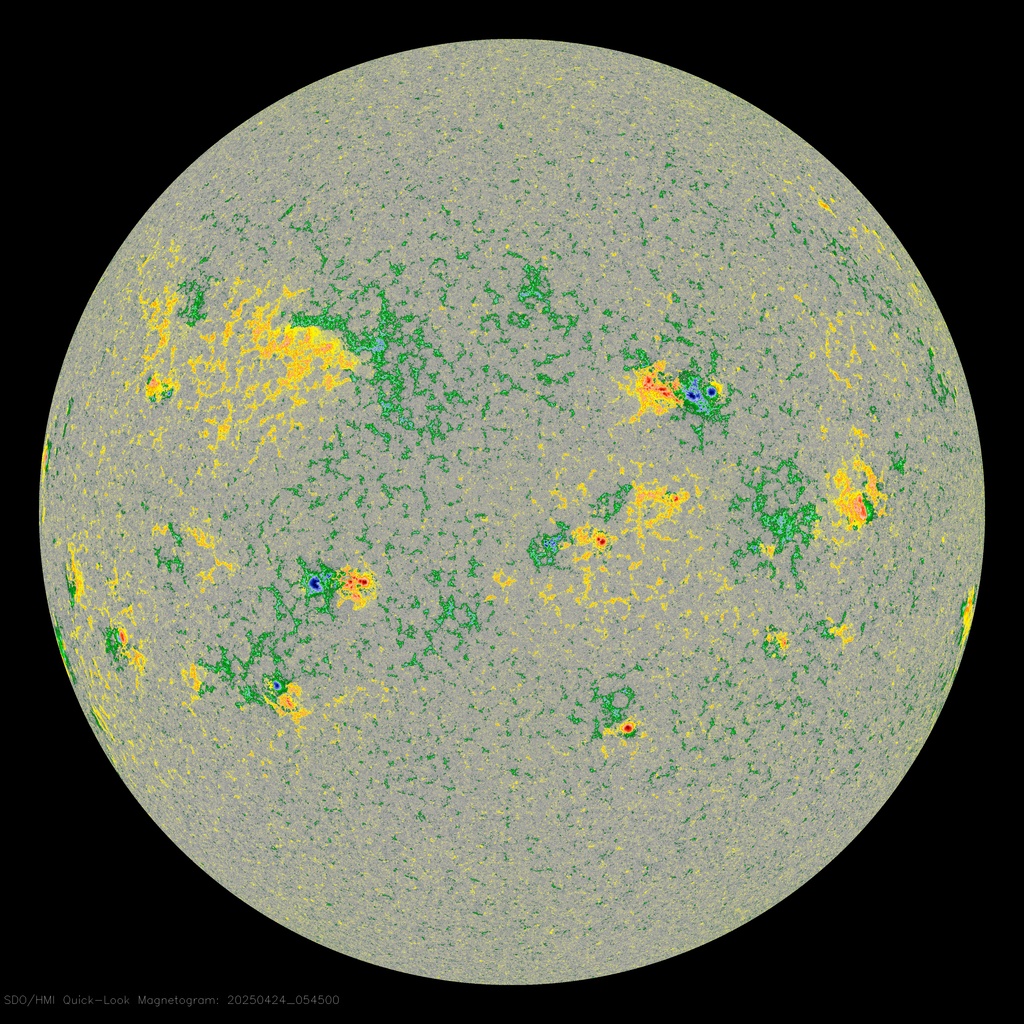
Multiple Wavelength Data Combined
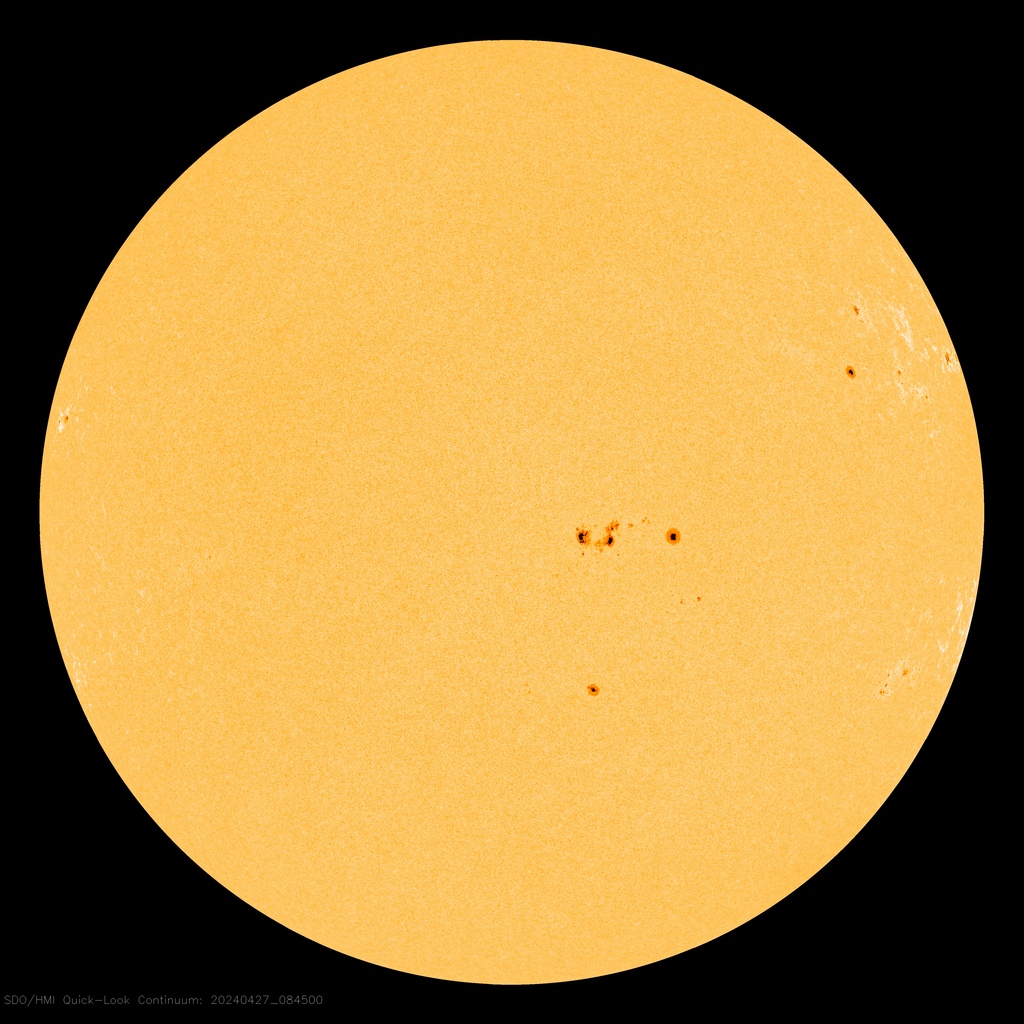
HMI Continuum Flattened
Matches visible light photosphere – Photographs of the solar surface, incorporating a broad range of visible light.
Continuums provide photographs of the solar surface, incorporating a broad range of visible light appearing yellow and orange.
The Sun, in particular AR11164 and 11165, produced over 30 small and medium-sized flares. 5 M- and 28 C-class flares. These flares released more than a million times the energy used by the entire population in one year. Here is a look at the sun in 1600, 304, 171 and 335 Angstroms over the 2 days as seen by the SDO/AIA instrument.
On April 19, 2012 the EUV cameras on SDO observed a C7 solar flare originating from an active area just over the west limb of the Sun. The video shows the flare around 11 UT as well as lots of nice loops in the 304, 171 and 131 Angstrom wavelength channels. This shows us plasma at temperatures around 60,000, 600,000 and 10 million Kelvin.
Argos (or Argus Panoptes) was the 100-eyed giant in Greek mythology (wikipedia). While the Solar Dynamics Observatory (SDO) has significantly less than 100 eyes, (see “SDO Jewelbox: The Many Eyes of SDO”), seeing connections in the solar atmosphere through the many filters of SDO presents a number of interesting challenges. This visualization experiment illustrates a mechanism for highlighting these connections.
The wavelengths presented are: 617.3nm optical light from SDO/HMI. From SDO/AIA we have 170nm (pink), then 160nm (green), 33.5nm (blue), 30.4nm (orange), 21.1nm (violet), 19.3nm (bronze), 17.1nm (gold), 13.1nm (aqua) and 9.4nm (green).
We’ve locked the camera to rotate the view of the Sun so each wedge-shaped wavelength filter passes over a region of the Sun. As the features pass from one wavelength to the next, we can see dramatic differences in solar structures that appear in different wavelengths.
Filaments extending off the limb of the Sun which are bright in 30.4 nanometers, appear dark in many other wavelengths.
Sunspots that appear dark in optical wavelengths are festooned with glowing ribbons in ultraviolet wavelengths.
Small flares, invisible in optical wavelengths, are bright ribbons in ultraviolet wavelengths.
If we compare the visible light limb of the Sun with the 170-nanometer filter on the left, with the visible light limb and the 9.4-nanometer filter on the right, we see that the ‘edge’ is at different heights. This effect is due to the different amounts of absorption, and emission, of the solar atmosphere in ultraviolet light.
In far-ultraviolet light, the photosphere is dark since the blackbody spectrum at a temperature of 5700 Kelvin emits very little light in this wavelength.
The movie opens with a full-disk view of the Sun in visible wavelengths. Then the filters are applied to small pie-shaped wedges of the Sun, starting with 170nm (pink), then 170nm (green), 33.5nm (blue), 30.4nm (orange), 21.1nm (violet), 19.3nm (bronze), 17.1nm (gold), 13.1nm (aqua) and 9.4nm (green). We let the set of filters sweep around the solar disk and then zoom and rotate the camera to rotate with the filters as the solar image is rotate underneath.
CREDITS: Animation Number: 4117 Completed: 2013-10-30; Animator: Tom Bridgman (GST); (Lead) Scientists: William D. Pesnell (NASA/GSFC); Barbara Thompson (NASA/GSFC); C. Alex Young (NASA/GSFC)
On April 8, 2010, the sun produced a relatively small solar flare and a blast wave (often called an EIT wave after the EIT telescope on SOHO or a solar tsunami). The blast wave shows us the motion of some of the solar material that made up the resulting Coronal Mass Ejection (CME) that traveled toward Earth.
The video shows both zoomed-in and zoomed out views of the solar eruption in multiple wavelengths of Extreme Ultraviolet light. The images are labeled with their corresponding wavelengths of light in units of Angstroms. Some images contain single wavelengths and others are composites of multiple wavelengths.
Here is a 2-week view of the sun as observed by the AIA (Atmospheric Imaging Assembly) instrument aboard the SDO (Solar Dynamics Observatory) spacecraft. This video contains 4 wavelength channels 304, 171, 193 & 211.
CREDIT: NASA / SDO, www.helioviewer.org